fixed-point integrator
The goal is to implement the fixed-point integrator of this block diagram:
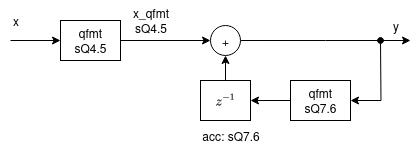
The ovf_method and rnd_method arguments of the qformat function expect
integers as inputs. For convenience, constants can be imported from qformatpy.constants
and used as arguments. Below, the SAT and TRUNC constants are imported.
import matplotlib.pyplot as plt
import numpy as np

from qformatpy import qformat as qfmt
from qformatpy.constants import SAT, TRUNC
We will start by implementing the integrator as a function:
def integrator(x: np.ndarray) -> np.ndarray:
    """Example of a simple fixed-point integrator."""
    len_x = len(x)

    # convert float input to sQ4.5 and saturation
    # qformat accepts receiving numpy arrays
    x_qfmt = qfmt(x, 4, 5, rnd_method=TRUNC, ovf_method=SAT)

    # implement accumulator
    acc = 0
    y = np.zeros(n_smp)
    for i in range(len_x):
        # Adder output
        y[i] = acc + x_qfmt[i]

        # The accumulator register is 13 bits, with
        # fixed-point format of sQ7.6. The default overflow
        # method is WRAP.
        acc = qfmt(y[i], 7, 5)

    return y
The input stimulus will be a DC signal with value of 1. A fixed-point integrator is expected to overflow for a DC signal.
# number of samples used for the simulation
n_smp = 2**18

# DC value of 5 + Gaussian noise
x = np.ones(n_smp)
y = integrator(x)
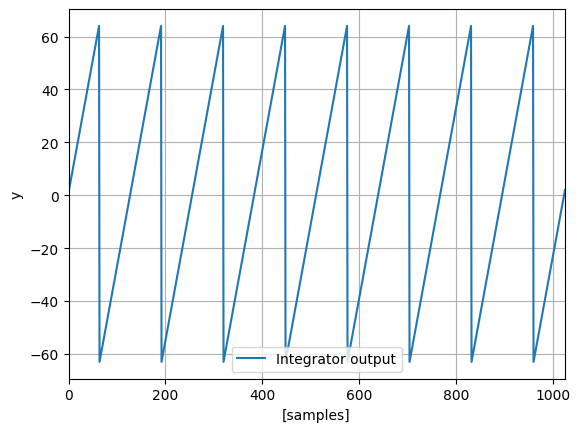
Plotting the output shows that the integrator overflows, as expected.
fig, ax = plt.subplots()
ax.plot(y, label="Integrator output")
ax.set_xlim([0, 1024])
ax.set_xlabel("[samples]")
ax.set_ylabel("y")
ax.legend()
plt.grid()
plt.show()